The Right way to use RSI Indicator
RSI Indicator is one of the most misused indicators as per me. RSI is supposed to tell us the strength of a security, instead people use it to use the strength as weakness. When RSI is above 80, the momentum is very bullish and similarly when RSI is below 20, momentum is very bearish. And the general school of thought with using RSI is to short when momentum is very bullish and go long when when momentum is very bearish. The whole idea kind of seems absurd.
The second school of thought is to use RSI indicator with another trend following indicator and find reversals in the direction of the trend. While on paper this sounds good, decent way to use the rsi indicator, the real problem with this is, this is a very very rare occurrence if it ever happens. If RSI is below 20 or 30 in a timeframe, the change of some trend following indicator to show a bullish trend is very slim if not impossible. And as we know for a good trading system opportunity count is also very important, if you have a system that gives you one trade in a year, it makes no sense to actually use it, knowing that no system is full proof.
RSI indicator for following trend
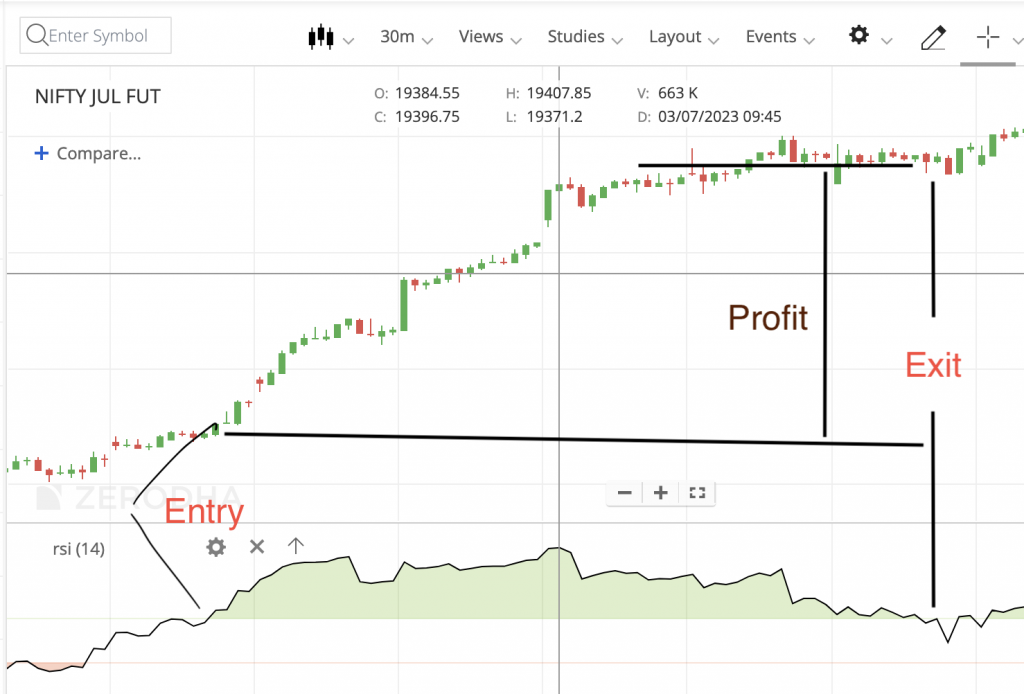
Now coming back to the third system, the way that I like and want to discuss. RSI can be used as a trend/momentum following system. What we do is change RSI values from the normal to 60 & 40, and then go long if RSI goes above 60, and short if RSI goes below 40. The middle part between 60 and 40 are considered as no momentum or no trend zones.
The best thing about trading this way is that you can go with the trend instead of fighting it. Also you can use it with another trend following indicator like supertrend to keep as a stop loss.
Watch my video below where I have discussed this in more detail